
The numbers first
- Price action reads trend, support, resistance and candle structure without relying on indicators.
- Patterns are probabilities, not signals; every setup needs a stop and a size before it needs a target.
- At very short timeframes, fees and spreads can outweigh the edge a pattern offers.
Price action is the study of how price itself has moved, read straight from a chart without layering indicators on top. Traders who use it look for the footprints of buyers and sellers: where price stalled, where it broke through, and how each candle opened and closed. It is a way of organising what has happened, not a way of knowing what comes next.
Candlesticks: four prices in one shape
Each candle records the open, high, low and close for its period. The body spans open to close; the wicks reach to the high and low. A long lower wick means sellers pushed price down and buyers pushed it back. A large body with small wicks shows one side in control for the whole period.
Named patterns such as the pin bar (a small body with one long wick) or the engulfing candle (a body that swallows the previous one) are shorthand for those stories. Their meaning depends on where they appear: a rejection wick at a level that has held before carries more weight than the same shape in the middle of nowhere.
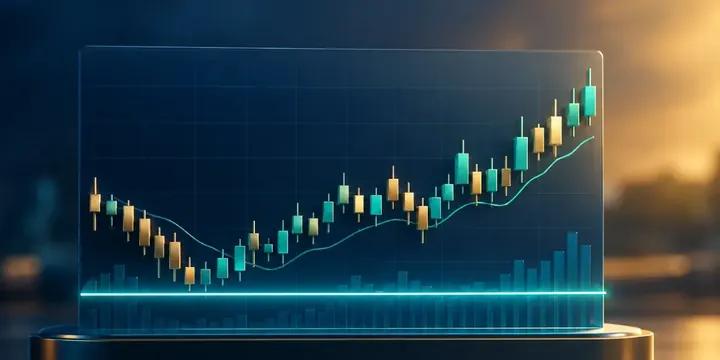
Trends and ranges
An uptrend is a series of higher highs and higher lows; a downtrend, lower highs and lower lows. When neither holds, price is ranging. Identifying which state the market is in comes before any pattern, because a pattern that works in a range (fading moves toward the edges) tends to fail in a trend, and the reverse is also true.
- Support is a price zone where falls have repeatedly stopped.
- Resistance is a zone where rises have repeatedly stalled.
- Levels are zones, not exact prices, and a broken level often switches role: old resistance can become support.
Breakouts and false breaks
A breakout is a move through a well-watched level. Many fail: price pokes through, triggers stop orders, then returns. Traders who use price action often wait for a close beyond the level, or for a retest of it, trading some of the move for more confirmation. Neither approach removes the risk of a false break.

Risk before reward
A setup is only complete with a stop and a size. The stop belongs where the idea is proved wrong, such as beyond the low of the rejection candle. The size follows from how much you accept losing, which the position size calculator works out.
Illustrative example: buying GBP/USD at 1.2500 with a stop at 1.2470 and a target at 1.2590 risks 30 pips to aim for 90, a reward-to-risk ratio of 3:1. That ratio means a trader could lose more often than they win and still come out ahead before costs, but it does not make any single trade more likely to work.
Price action on currency pairs and gold
Currency pairs and gold trade almost around the clock, so levels formed in one session are often tested in the next. Many chart readers pay particular attention to the previous day's high and low and to round numbers such as 1.2500, simply because so many orders cluster there.
Timeframes and noise
The same principles apply on a weekly chart and a one-minute chart, but shorter timeframes contain more random movement relative to the trend. They also produce many more trades, which multiplies costs. Many practitioners use a higher timeframe to decide direction and a lower one to time entries.
Scalping crypto: where costs decide the result
Scalping crypto means taking many very small moves on short charts, often for fractions of a percent. The chart patterns are the same, but the arithmetic is harsh. Illustrative example with a 0.1% fee on each side of a $5,000 position:
- A 0.3% gain: the position rises to $5,015, the buy fee is $5 and the sell fee about $5.01, leaving roughly $4.99.
- A 0.3% loss: the position falls to $4,985, and after the same two fees the result is roughly −$24.99.
- To break even with equal-sized wins and losses, the strategy would need to win about 83% of the time.
That is before spread and slippage, which are larger on less liquid coins and during fast moves. Fee structures are explained in trading fees explained. In the UK, crypto derivatives cannot be sold to retail clients, and in the EU retail crypto CFDs are capped at 2:1 leverage.
A simple routine for reading a chart
- Start on a higher timeframe and mark the obvious swing highs and lows.
- Decide whether the market is trending or ranging, and in which direction.
- Mark the nearest support and resistance zones on your trading timeframe.
- Wait for price to reach a zone and look at how candles behave there.
- Only then set the entry, stop and size, and check the cost of the trade.
The routine will not tell you whether a trade will work. It makes sure every trade has a reason, a defined exit and a size that fits the account.
Keeping a trade journal
Price action is subjective, so records matter. Saving a screenshot of each chart at entry, the reason for the trade, the planned stop and target, and the result after costs builds evidence over dozens of trades. Reviewing that record shows which setups actually worked for you, which were impulses, and how much of your result went to fees and spreads.
Limits of price action
Patterns are subjective: two traders can label the same chart differently. Results depend heavily on costs, discipline and position sizing, and a method that looks convincing on past charts can fail once real money and real spreads are involved. Treat price action as a framework for planning trades, not as a prediction tool.
Reader questions
Is price action better than using indicators?
Neither is inherently better. Most indicators are calculated from price, so they summarise the same information. Price action simply reads it directly; what matters more is risk control and costs.
What timeframe is best for price action?
There is no best one. Higher timeframes contain less noise and generate fewer trades, which keeps costs down; lower timeframes need very tight cost control.
Is scalping crypto profitable?
It can be for some, but fees on both sides of every trade, spreads and slippage take a large share of small gains. Many scalping approaches that look profitable before costs lose money after them.